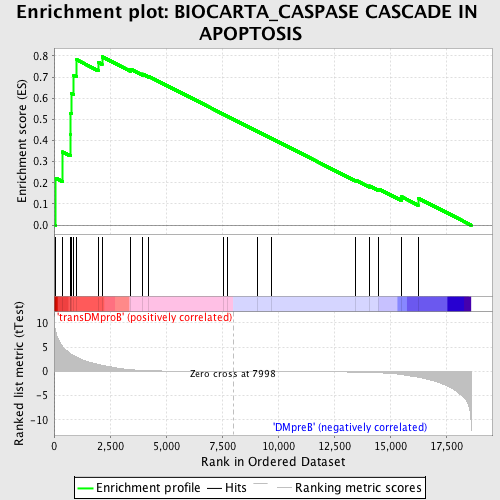
Profile of the Running ES Score & Positions of GeneSet Members on the Rank Ordered List
| Dataset | Set_04_transDMproB_versus_DMpreB.phenotype_transDMproB_versus_DMpreB.cls #transDMproB_versus_DMpreB.phenotype_transDMproB_versus_DMpreB.cls #transDMproB_versus_DMpreB_repos |
| Phenotype | phenotype_transDMproB_versus_DMpreB.cls#transDMproB_versus_DMpreB_repos |
| Upregulated in class | transDMproB |
| GeneSet | BIOCARTA_CASPASE CASCADE IN APOPTOSIS |
| Enrichment Score (ES) | 0.79553884 |
| Normalized Enrichment Score (NES) | 1.5407708 |
| Nominal p-value | 0.008048289 |
| FDR q-value | 0.22388203 |
| FWER p-Value | 0.974 |
| PROBE | DESCRIPTION (from dataset) | GENE SYMBOL | GENE_TITLE | RANK IN GENE LIST | RANK METRIC SCORE | RUNNING ES | CORE ENRICHMENT | |
|---|---|---|---|---|---|---|---|---|
| 1 | CASP4 | 19576 2983 | 74 | 8.121 | 0.2215 | Yes | ||
| 2 | CASP7 | 23826 | 383 | 5.080 | 0.3460 | Yes | ||
| 3 | CASP1 | 19577 | 733 | 3.619 | 0.4277 | Yes | ||
| 4 | LMNB2 | 19685 | 741 | 3.597 | 0.5272 | Yes | ||
| 5 | CASP8 | 8694 | 770 | 3.525 | 0.6235 | Yes | ||
| 6 | PARP1 | 8559 14027 | 878 | 3.244 | 0.7078 | Yes | ||
| 7 | CASP2 | 8692 | 1012 | 2.909 | 0.7814 | Yes | ||
| 8 | APAF1 | 8606 | 1988 | 1.417 | 0.7684 | Yes | ||
| 9 | BIRC2 | 4397 4398 | 2142 | 1.276 | 0.7955 | Yes | ||
| 10 | ARHGDIB | 16950 | 3404 | 0.360 | 0.7377 | No | ||
| 11 | CASP3 | 8693 | 3937 | 0.195 | 0.7145 | No | ||
| 12 | PRF1 | 20011 | 4217 | 0.145 | 0.7036 | No | ||
| 13 | GZMB | 21810 | 7573 | 0.005 | 0.5233 | No | ||
| 14 | SREBF1 | 9885 | 7726 | 0.003 | 0.5152 | No | ||
| 15 | DFFB | 15654 | 9083 | -0.015 | 0.4427 | No | ||
| 16 | CASP9 | 16001 2410 2458 | 9691 | -0.024 | 0.4107 | No | ||
| 17 | LMNA | 4999 15290 1778 9280 | 13455 | -0.151 | 0.2126 | No | ||
| 18 | LMNB1 | 23549 1943 | 14078 | -0.216 | 0.1851 | No | ||
| 19 | CASP6 | 15422 1885 | 14496 | -0.282 | 0.1705 | No | ||
| 20 | BIRC3 | 19247 | 15500 | -0.653 | 0.1347 | No | ||
| 21 | DFFA | 4627 | 16250 | -1.181 | 0.1272 | No |

